

Mercado Libre
- Mercado Libre is the largest online commerce and payments ecosystem in Latin America, operating in 18 countries with hundreds of millions of users.
- Mercado Libre is exploring how to scale up the use of GitHub Copilot, an AI pair-programming tool, to the entire team.
- One developer at Mercado Libre has seen a 50% improvement in productivity using GitHub Copilot on personal projects.
- Mercado Libre believes that GitHub Copilot has the potential to significantly increase the number of features it can offer to customers.
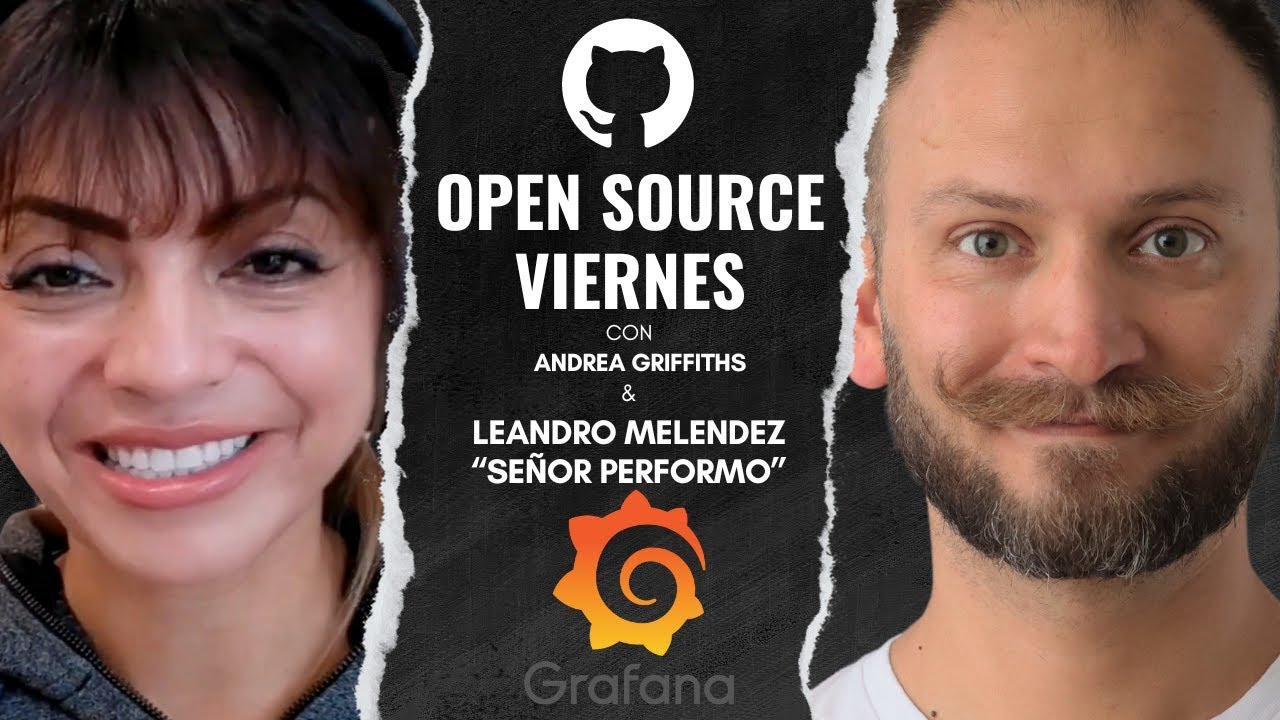
Señor Perf
- Señor Perf is a podcast host, international speaker, and advocate for open-source projects.
- He has a popular YouTube channel where he creates educational content related to performance testing and automation.
- Señor Perf started his career as a software development consultant and later transitioned into project management, infrastructure, and database administration roles.
- He gained expertise in performance testing and created the "Señor Perf" persona to share his knowledge through blogs, podcasts, and YouTube videos.
- After some time, Grafana acquired k6, and Señor Perf became a Grafana advocate for Internet of Things and Business Intelligence.
- Despite not having extensive experience in those areas, his passion for Grafana and his advocacy skills led him to secure the role.
Observability and Grafana
- Observability is the ability to know the state or metric of something without directly examining it.
- Telemetry is the data generated by instrumented devices or systems.
- Instrumentation involves equipping devices or systems with sensors to generate telemetry data.
- Observability involves collecting and storing data over time to predict future trends and patterns.
- Grafana is an open-source platform that enables users to visualize and analyze data from various sources, including servers, containers, and IoT devices.
- Grafana supports different types of data, including logs, metrics, and traces, providing a comprehensive view of system behavior.
- Grafana's visual representation of data makes it easier to identify patterns, trends, and anomalies.
Grafana Features
- Grafana's alerting feature allows users to set up notifications for specific events or conditions, reducing the need for constant monitoring.
- Grafana can be installed on various platforms, including Docker, Linux, Windows, Mac, and even Raspberry Pi.
- Grafana connects to different data sources, such as databases, and allows users to create visualizations and dashboards to monitor and analyze data.
- Users can create various types of visualizations, including time series, bar graphs, gauges, tables, pie charts, and more.
- Grafana allows users to customize and modify visualizations, such as adding labels, changing colors, and adjusting sizes.
- Dashboards can be created to organize and display multiple visualizations together.
- Grafana supports a wide variety of data sources, including InfluxDB, Prometheus, and MySQL.
- Dashboards can be shared with others and can be set to refresh automatically.
- Grafana also includes alerting features that can notify users when certain conditions are met.
- Users can create their own data connectors if the data source they need is not already supported.
- Grafana can be used to visualize data from a variety of sources, including Excel files and JSON data.
Grafana Use Cases
- Grafana can be used for personal projects, such as tracking personal health data or monitoring home automation systems.
- Grafana is used by many organizations, including NASA, for monitoring and visualizing data.
- Grafana is a versatile tool that can be used for a wide range of applications, from simple visualizations to complex data analysis.
Upcoming Events
- The speaker will be attending several conferences in the coming months, including Testing Uruguay, Star East, and Testing United.
- The speaker will be releasing new videos on his YouTube channel, Señor Perf, in the near future.
Conclusion
- The evolution of technology has significantly impacted software development and infrastructure.
- The power of data and data visualization extends beyond technology, offering valuable insights and applications in various fields.
- The speaker expresses gratitude for the opportunity to share knowledge and connect with the audience.
- The speaker invites viewers to subscribe to the "Señor Perform" YouTube channel for more valuable content.
- The speaker announces the upcoming "Nerdlearla" conference in Chile, highlighting its top-notch content, talent, and surprises.